The Purpose and Description of the Assignment
The purpose of this assignment is to reinforce your comprehension of the Tennis Grand Slam tournaments and apply the knowledge you gained throughout the lesson to create a detailed infographic to present your understanding to the Tennis enthusiasts.
There are three milestones that guide you to the completion of this assignment:
- The first discussion is to create information checklists,.
- The second is a follow-up discussion.
- The final is a presentation.
There will be 4 groups of five students working on different Grand Slam tournaments. The presentation will focus on the infographic created by your group instead of a slide show. Each group will have at least one person giving the presentation to the class.
Assignment Details and Steps
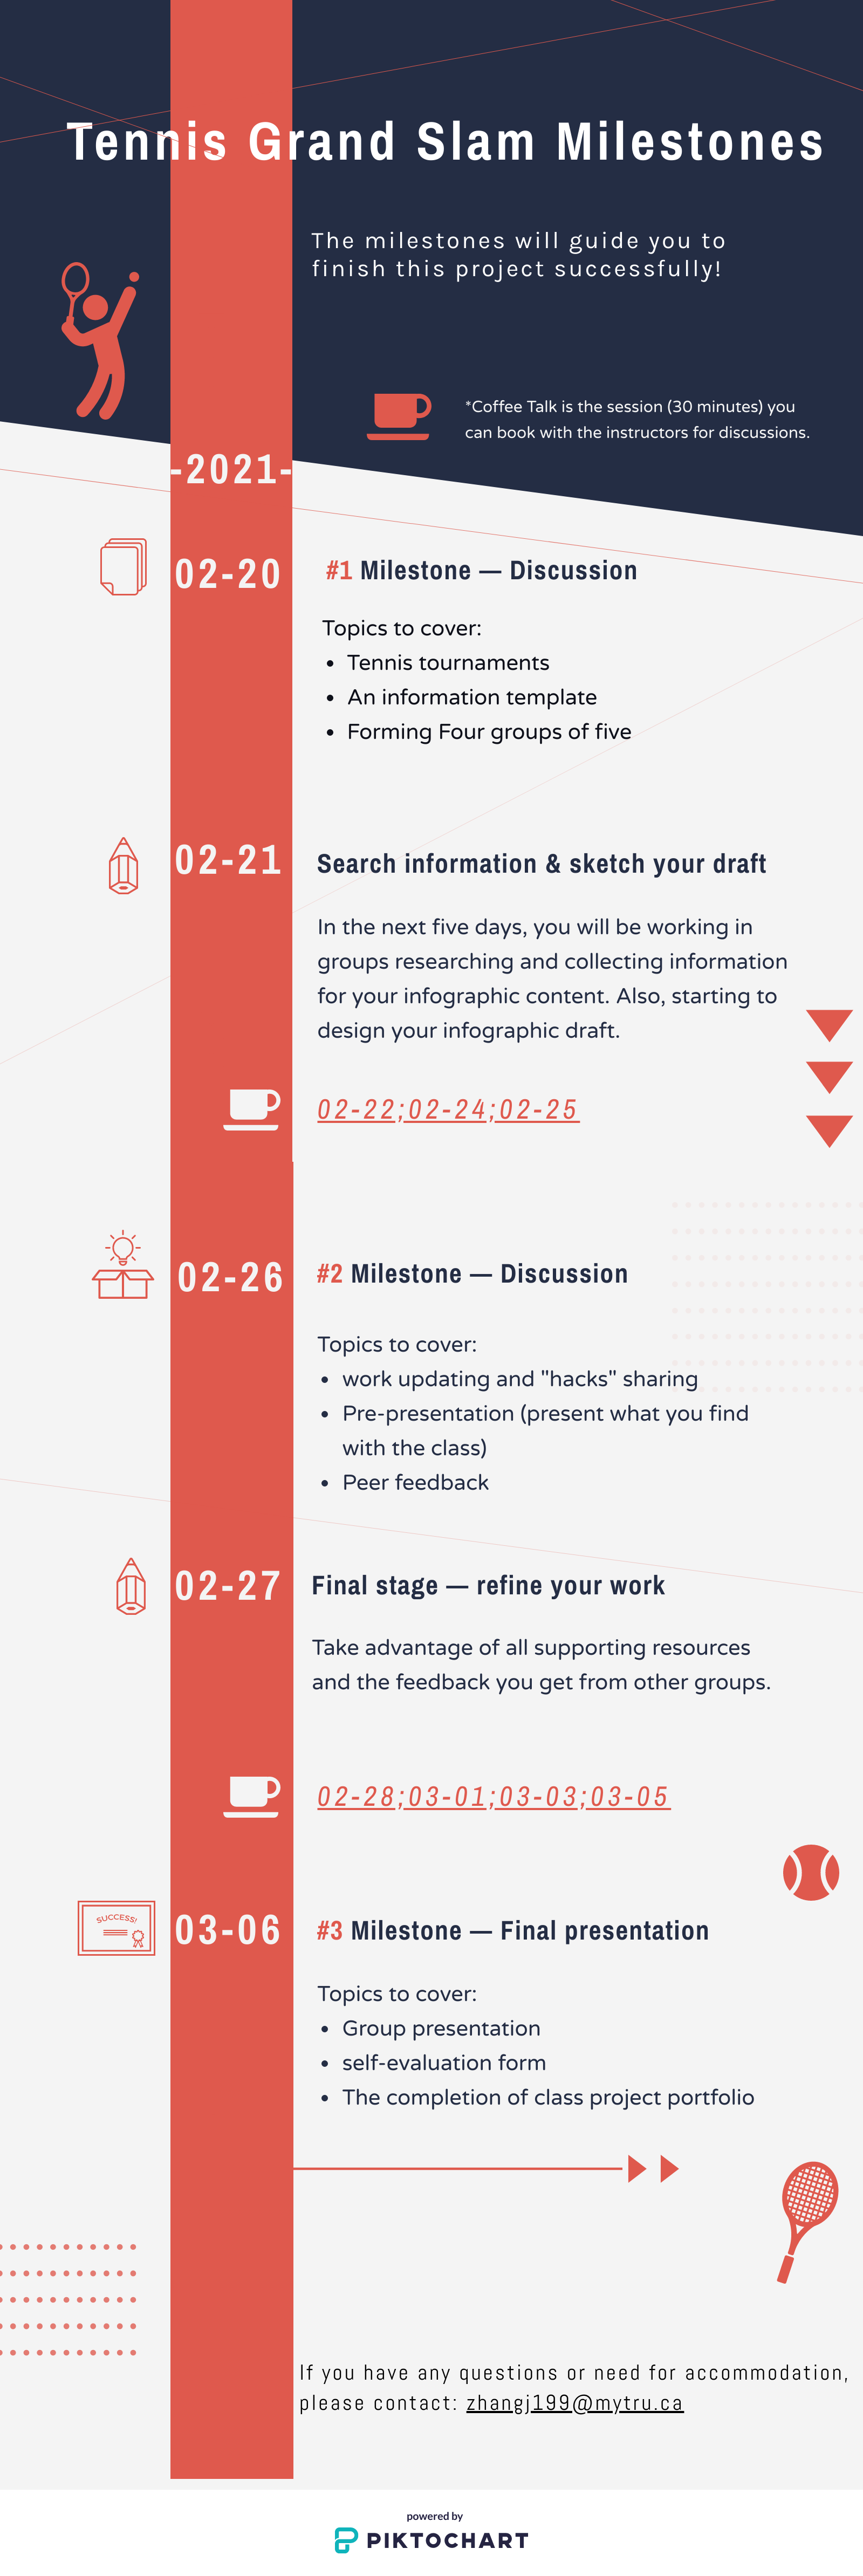
1. The first discussion (#1 milestone) – week 1
- We will talk about the tennis tournaments (relate to your prior knowledge).
- We need to decide the most relevant and popular information you would like to know about a Grand Slam tournament.
- We will create a list of questions and information to be discovered in the project (an information template).
- You will form four groups of five, and each group selects one of the four Grand Slam tournaments as your group topic.
2. You will work in groups to search information and design your infographic draft.
Supporting resources:
3. The second discussion (#2 milestone) – week 2
- You will update the work process and share challenges or “productivity hacks” found in the project.
- Each group will prepare a short presentation in any format during the discussion.
- After each group presentation, you will provide peer feedback to other groups.
4. After you have received your feedback from the class, you will be working on refining your final project – the infographic and presentation.
Supporting resources:
5. Final presentation (5 to 10 minutes) and the final portfolio (#3 milestone)
- You will present your final work and give the final presentation to the class.
- After the presentation, you will complete your self-evaluation form in class to reflect on “What did you learn?” and “How could you do better?”
- The final class project portfolio is complete by all of your hard work.
*During the two weeks, there are several Coffee Talk (30 minutes) appointments available. You can book any session for your convenience. The Coffee Talks are to help you if you have any questions or meet any difficulties, we can figure them out together!
The visualized milestones for the assignment:

Visual milestones
Rubric
Make sure to read the rubric for criteria, ratings, and point value for the expectations.
| Components | 4—Excellent | 3—Good | 2—Fair | 1—Needs Improvement |
| Knowledge | ||||
| Concepts | The topic of the infographic well presents all of the required information and is highly aligned with the purpose of the project. | The topic of the infographic presents most of required information and is well aligned with the purpose of the project. | The topic of the infographic presents some of required information and is almost aligned with the purpose of the project. | The topic of the infographic presents only little of the required information and is barely aligned with the purpose of the project. |
| Research and information accuracy | Final product reflects research done beyond what was required and the information is accurate. | Final product reflects adequate research, and all of the information is accurate. | Final product reflects some research, and most of the information is accurate. | Minimal research was done, and some of the information is inaccurate. |
| Skills | ||||
| Creativity and quality of the design | The overall design is extraordinarily creative in terms of the graphic used and layout. Message is clear and compelling. | The overall design is creative in terms of the graphic used and layout. Message is clear. | The overall design is acceptable; but could be improved through better layout and graphic presentation. The message is slight unclear. | The overall design is unorganized and distractingly. The message is absent and contradictory. |
| Typography | The infographic includes an appropriate font to both complement the content and make the text readable. | The infographic includes the font to make the text readable and relevant. | The infographic includes multiple fonts and/or the fonts do not seem related to the infographic topic. | The font(s) used in the infographic make the text almost unreadable. |
| Contrast and color | All of the white space is used strategically, and the color used to enhance the meaning of the work. | Most of the white spaces are used well, and colors are used appropriately. | The use of white space could be enhanced. Color choices could be improved to support the design. | Lack of contrast due to the poor of white space and imbalanced color combination. |
| Process | ||||
| Presentation delivery | • Holds attention of entire audience with the use of direct eye contact, seldom looking at notes
• Speaks with fluctuation in volume and inflection to maintain audience interest and emphasize key points |
• Consistent use of direct eye contact with audience, but still returns to notes
• Speaks with satisfactory variation of volume and inflection |
• Displays minimal eye contact with audience, while reading mostly from the notes
• Speaks in uneven volume with little or no inflection |
• Holds no eye contact with audience, as entire report is read from notes
• Speaks in low volume and/ or monotonous tone, which causes audience to disengage |
| Team collaboration | Routinely provides useful ideas when participating in the group and in classroom discussion. A leader who contributes a lot of effort. | Usually provides useful ideas when participating in the group and in classroom discussion. A strong group member who tries hard!
|
Sometimes provides useful ideas when participating in the group and in classroom discussion. A satisfactory group member who does what is required.
|
Rarely provides useful ideas when participating in the group and in classroom discussion. May refuse to participate.
|
References
Piktochart Video. (2017). Piktochart Tutorial: A Simple Guide to Piktochart for Beginners [Video]. YouTube. https://www.youtube.com/watch?v=Eq-85gzw3GI
Piktochart. (n.d.). https://piktochart.com/
Purdue Writing Lab. (n.d.). Evaluating digital sources // Purdue Writing Lab. https://owl.purdue.edu/owl/research_and citation/conducting_research/evaluating_sources_of_information/evaluating_digital_sources.html
Tucker, C. (2012). Google search: 10 questions & answers to help you search smarter! Dr. Catlin Tucker. https://catlintucker.com/2012/04/google-search-10-questions-10-answers-to-help-you-search-smarter/
Venngage. (n.d.). The ultimate infographic design guide – 13 easy design tricks. https://venngage.com/blog/infographic-design/

Leave a Reply
You must be logged in to post a comment.